Stories | 09.12.2020
Tropical forests play key roles in the functioning of global environmental systems. For example, they are major climate regulators, taking up and storing carbon to mitigate climate change. They also provide multiple other ecosystem services, such as provision of food, freshwater, raw materials and medicinal resources (Mitchard, 2018; Nobre and Borma, 2009).
The world has total forest cover of 4.06 billion hectares, of which 1.8 billion hectares (or 45%) is tropical forest (FAO, 2020, pp. 1). Figure 1 shows global forest cover by the four climatic domains: tropical, boreal, temperate and subtropical.
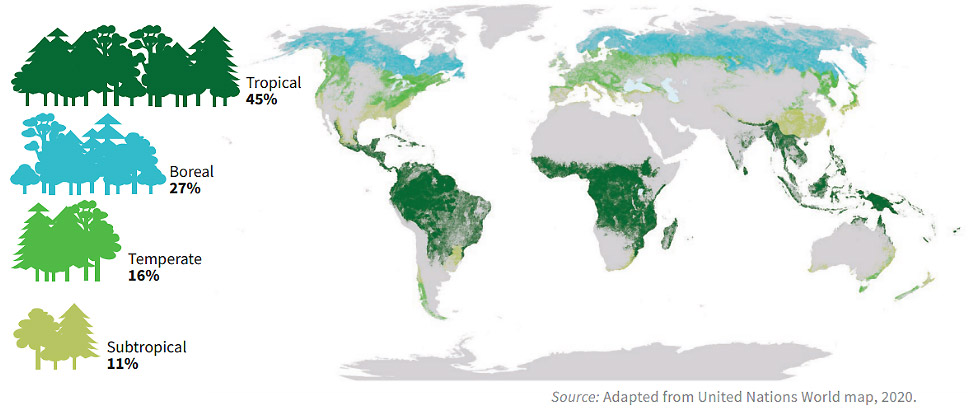
Figure 1: Proportion and distribution of global forest cover by climatic domain in 2020 (FAO, 2020, pp. 1).
Since the 1990s, the global average tropical deforestation rate has been 0.5% per year. This forest loss has mainly been caused by expansion of agricultural land and urban areas (Achard et al., 2014; Lewis et al., 2015; Taubert et al., 2018; Seymour and Harris, 2019). The deforestation rate, however, differs between continents and countries. Over 80% of the total occurs in just four countries; Brazil, Indonesia, Democratic Republic of the Congo and Malaysia (Seymour and Harris, 2019).
At the same time, several countries are classified as ‘high forest cover and low deforestation’ (HFLD ). In recent years, the UN programme to Reduce Emissions from Deforestation and Forest Degradation (REDD+) has rated the following as HFLD; Suriname, Panama, Colombia, Peru, Belize, Gabon, Guyana, Bhutan, Zambia and French Guiana (REDD+, 2007).
A forest’s total carbon stock is stored in five different carbon pools: above ground biomass, below ground biomass, dead wood, litter and soil carbon (Eggleston et al., 2006).
The total carbon stock of all tropical forest areas in South-America, sub-Saharan Africa, Southeast Asia and Oceania together has been estimated at 247 gigatonnes of carbon (1 gigatonne = 1 billion tonnes), with 193 gigatonnes stored in aboveground biomass and 54 gigatonnes stored in below ground biomass (which is carbon stored in roots) (Figure 2) (Saatchi et al., 2011). To put these values into perspective, in the period 2012-2018, the total accumulated global greenhouse gas emissions amounted to 51.8 gigatonnes CO2 equivalent (Olivier and Peters, 2020).
The biomass stored in the different parts of a tree depends on various factors and differs between species, but can broadly be divided between roots, 27%, trunk, 32%, branches, 31%, and foliage, 10% (Sinacore et al., 2017). Thus, only 32–63% (trunk plus branches) of the total carbon stock per tree is removed from the forest when timber harvesting takes place.
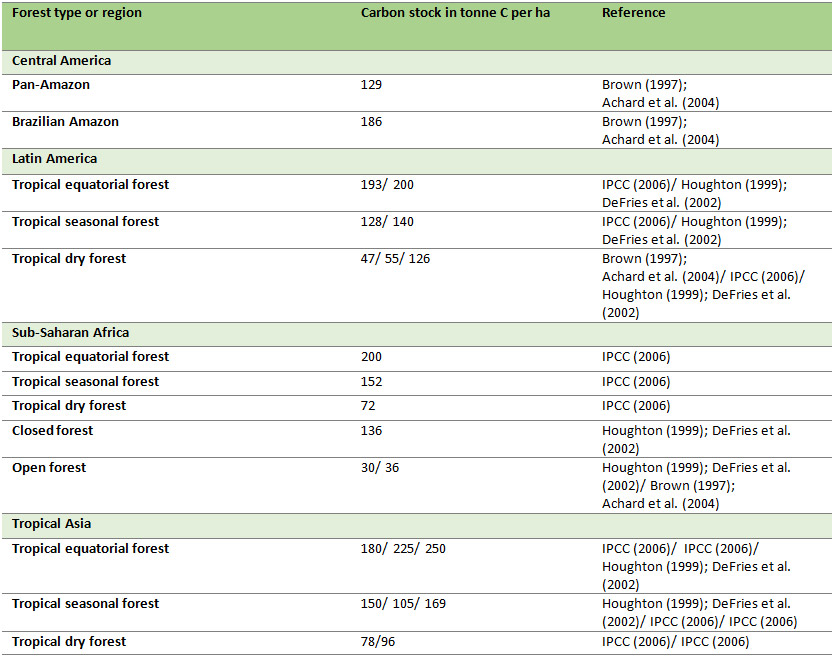
Carbon stock estimates from tropical forest areas vary widely across the globe and Table 1 provides an overview, with values ranging between forest type and region from 30 to 250 tonnes of carbon per hectare.
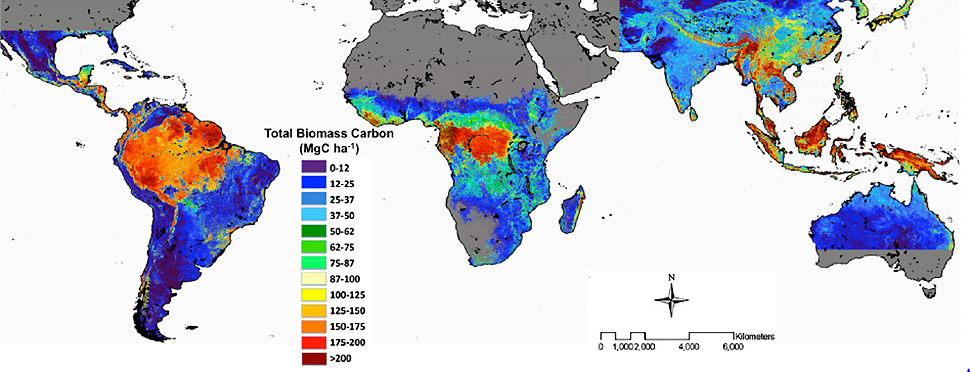
Figure 2: Map with the estimated total carbon stock in megagram carbon per hectare, stored in the aboveground biomass and belowground biomass (i.e. roots, not soils) of tropical forest areas in South-America, sub-Saharan Africa, Southeast Asia and Oceania (Saatchi et al., 2011).
Table 1: Biome-average tropical forest carbon stock estimates in tonne carbon per hectare (adapted from Gibbs et al., 2007 and Ramankutty et al., 2007). Note that this table looks at mass of carbon, while the mass of carbon dioxide (CO2) is 3.67 times that of carbon.
Tropical forests are complex ecosystems that provide many different ecosystem services. These contribute to human wellbeing on local, regional, and global scales. For example, on a local scale, communities in the Brazilian Amazon harvest fruit from the forest for consumption and on a commercial basis. This results in health benefits and increased income. An example on the global scale is that tropical forests are important carbon sinks, taking the greenhouse gas CO2 from the atmosphere.
Although complicated, ecosystem services can be valued in economic terms. The total economic value (that is, the value of all ecosystem services combined) of the entire global tropical forest domain is estimated at 2,700 US dollars per hectare per year (Costanza et al., 1997). With a global tropical forest cover of 1.8 billion hectares, the total value amounts to 4,860 billion US dollars, also referred to as the ‘Total Economic Value’ or the ‘natural capital value’. More recently, the economic value of tropical forest areas in three different regions, the Americas (A), sub-Saharan Africa (B), and Asia and Oceania (C), have been estimated at 0–300 to 6,000–9,000 US dollars per hectare per year (Carrasco et al., 2014) (Figure 3).
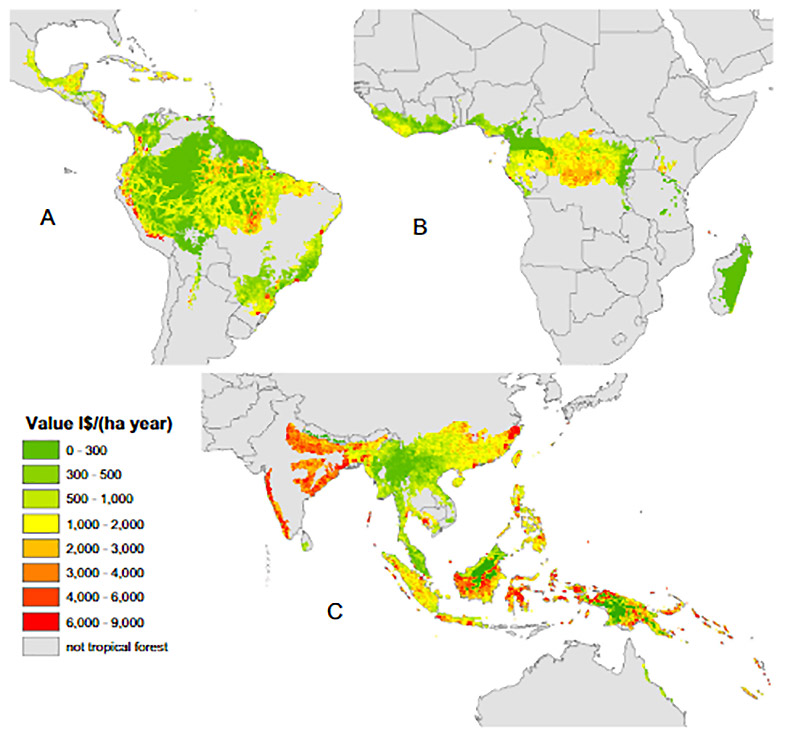
Figure 3: Map with total economic values of ecosystem services from tropical forest areas in the Americas (A), sub-Saharan Africa (B), and Asia and Oceania (C) in US dollars per hectare per year (from Carrasco et al., 2014, pp. 168).
Currently, 6.5% of the total global natural- and semi-natural production forest area in the tropics is certified sustainably managed (FSC or PEFC and excluding plantation forests) (IDH, 2019, pp. 5).
The certified (FSC and PEFC) forest areas from which timber products derive are situated in Latin America, the Congo Basin and Southeast Asia, with:
Increased demand for verified sustainable tropical timber is urgently needed to help spread responsible forest management in tropical countries. It is calculated that, if the seven leading European tropical timber-importing countries bought exclusively verified sustainable material, an additional 12.5 million hectares of tropical forest would come under sustainable management to meet that demand (IDH, 2019).
1. Deforestation is defined as ‘the conversion of forest to other land uses regardless of whether it is human-induced’ (FAO, 2020).
2. Countries with more than 50% forest cover and a deforestation rate below 0.22% per year are considered to fall into the High forest cover, low deforestation (HFLD) category, as described by the REDD Desk. HFLD countries together contain 20% of Earth’s remaining tropical forest and account for 18% of tropical forest carbon.
3. There exists however uncertainty in the reported values by Saatchi et al. (2011). This ranges from ±6% to ±53 depending on the location.
4. IDH (2019). Unlocking Sustainable Tropical Timber Market Growth Through Data. Accessible online at: https://www.idhsustainabletrade.com/uploaded/2019/11/IDH-Unlocking-sust-tropical-timber-market-growth-through-data.pdf
References